Sales Performance Dashboard
This is final task for project-based internship Business Intelligence Analyst Bank Muamalat X Rakamin Academy.
Hi, my name is Moch Dimas Nurulloh, welcome to my personal page!
I'm thrilled to have you here as I embark on my data analytics journey. This page is a reflection of my dedication and passion for the world of data, where I explore the remarkable projects that have shaped my understanding and expertise.Come, join me as I share my insights, experiences, and the incredible projects that have defined my data analytics odyssey.
Let's dive into the world of data together and discover the exciting insights waiting to be uncovered.
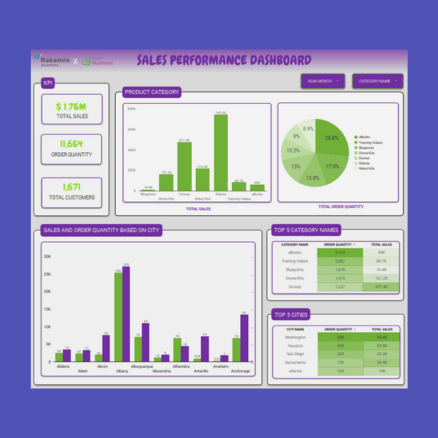
This is final task for project-based internship Business Intelligence Analyst Bank Muamalat X Rakamin Academy.
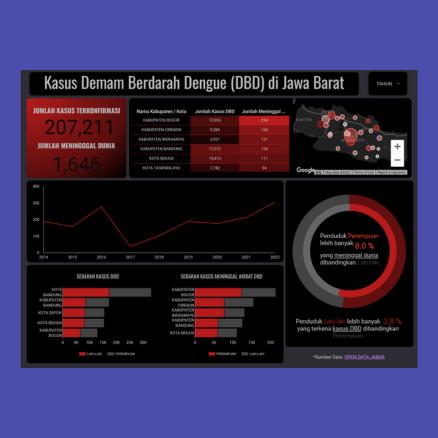
This is dashboard about my personal project, the dataset I use is from the "Open Data Jabar" website.
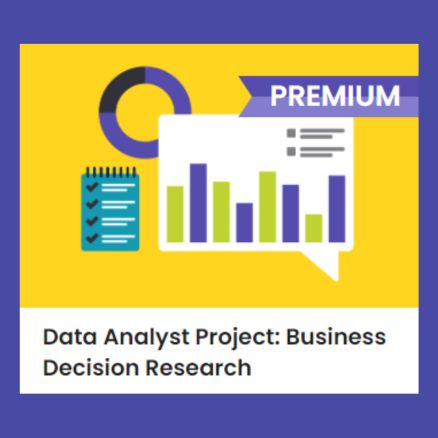
This project is to complete Data Analyst Career Track (Python) DQ Lab Academy.
A passionate data enthusiast with a knack for turning numbers into insights. Graduated from several data courses, and have the knowledge, also skills to work with various tools for analyzing and visualizing data. Currently, I'm trying to career switch from a background in engineering to data and looking for opportunities to continue developing my skills for the role of data analyst or business intelligence analyst, and these are all the skills that I often use:
to organize, analyze, and visualize data through spreadsheets, offering features like data manipulation, formula calculations, charts, and data filtering.
libraries like Pandas for data manipulation, NumPy for numerical operations, Matplotlib and Seaborn for data visualization, and Jupyter notebooks for interactive data exploration. These tools are widely used in data analysis and provide a powerful environment for tasks like data cleaning, transformation, and visualization.
software applications used to query, manipulate, and analyze data in relational databases.
streamlined data exploration and visualization that I often use is Looker Studio, Tableu and now I'm learning a little about Power BI.
Analytical thinking is the ability to examine, interpret, and evaluate information or data in a systematic, logical, and detail-oriented manner to make informed decisions, solve problems, and draw meaningful conclusions.
Problem-solving is the process of finding solutions to challenges or obstacles by identifying, analyzing, and implementing effective strategies or actions to achieve desired outcomes or resolutions.
I'd love to connect with you and discuss my data analytics journey and the exciting projects I've been working on. Feel free to reach out and let's chat about the world of data analytics, my experiences, and the fascinating insights I've uncovered.
Don't hesitate to get in touch, I'm always eager to share my passion for data and connect with fellow enthusiasts like you. Looking forward to our conversation!